Tokio console and RR debugger
First, you need to install RR from your preferred source. Check out its website for more information on installing RR:
Now, keep in mind that RR is only officially supported on x86/64 Linux.
Your CPU also matters:
- AMD requires a special workaround script called
zen_workaround.py, which can be found here https://gitlab.ii.zone/lukas.hozda/workshop-debugging/-/blob/master/zen_workaround.py. Only ZEN CPUs are supported out of the whole AMD repertoire. - Intel mainstream CPUs are fine, but Intel Atom and Celeron are not supported
- ARM and arm architectures only have an experimental supports, nothing to write home about at this time.# Tokio console & RR debugger
The purpose of this workshop is to demonstrate the use of two tools useful for diagnosing problems in an effective manner.
These tools are:
- tokio-console - a tool to peer into the Tokio runtime of your app
- rr - a time-traveling debugger
Supplementary files for these examples can be found in this repository:
https://gitlab.ii.zone/lukas.hozda/workshop-debugging
Tokio console
The console is a conceptually simpler tool, it lets you debug and profile
asynchronous Rust applications using the Tokio framework, by reading events
emitted by trough the tracing library.
In case you haven't met with tracing directly yet (perhaps because you may
be referring to bosminer::log for logging), it is the favored logging framework
we use at Braiins.
You can find out more about tracing here:
https://docs.rs/tracing/latest/tracing/
Tokio console fits in as a layer, or optionally the whole subscriber for tracing (in case you haven't used it previously).
To be able to use the tokio console, you need to be using a relatively recent version of tokio, everything 1.1x should be fine, but latest version is optimal.
Furthermore, you will have to enable tokio unstable. In order to make it impossible
for a dependency to turn on the unstable features for the whole tree including
your application, unstable is not a feature, but a compiler config value
(you have already likely encountered the test config value, which is used when running
tests).
The tokio unstable features are enabled like this:
RUSTFLAGS="--cfg tokio_unstable" cargo <command>
Because having to type use this every time you want to run a command might be suboptimal,
you can use cargo config to apply these flags to rustc on every invocation automatically:
# .cargo/config.toml of your project
[build]
    rustflags = ["--cfg", "tokio_unstable"]
That's it.
Now, you need to add the console library to your project:
cargo add console-subscriber
And install the console itself:
cargo install tokio-console
In your projects async fn main() function, you can set up the console like this:
#![allow(unused)]
fn main() {
console_subscriber::init();
}
If you already use tracing, you might have a specific setup for your subscriber, and might prefer adding the tokio console as a layer instead.
The following example also demonstrates configuration options:
#![allow(unused)]
fn main() {
let console_layer = console_subscriber::ConsoleLayer::builder()
    .retention(Duration::from_secs(60))
    .server_addr(([127, 0, 0, 1], 6669))
    .spawn();

tracing_subscriber::registry()
    // add the console layer to the subscriber
    .with(console_layer)
    // add other layers...
    .with(tracing_subscriber::fmt::layer())
    // .with(...)
    .init();
}
It is a particularly good idea to set retention, otherwise, the console TUI will keep all finished tasks forever, which may be too much clutter to orient oneself properly.
Now, if you run your application, you should see a lot of log entries, that look like this:
2022-10-13T06:10:09.881247Z TRACE runtime.spawn{kind=task task.name= task.id=51 loc.file="/root/.cargo/registry/src/kellnr.ii.zone-97b060856f9e2fcb/ii-async-utils-0.1.0/src/halthandle.rs" loc.line=363 loc.col=13}: tokio::task::waker: op="waker.clone" task.id=1
That means it's working.
In case you don't see any of those, you might have disabled the TRACE level in tracing. To use the console, you need to enable it.
Now, you can connect to the process if you use the tokio-console command.
The default one-liner config should allow the console to connect automatically, otherwise, use this syntax:
tokio-console http://<ip-or-hostname>:<port>
Keep in mind that if you forget the http:// or make a mistake in the
address, the console will hang forever without indicating any sort of error.
It is what it is.
If all goes well, you should see something like this:
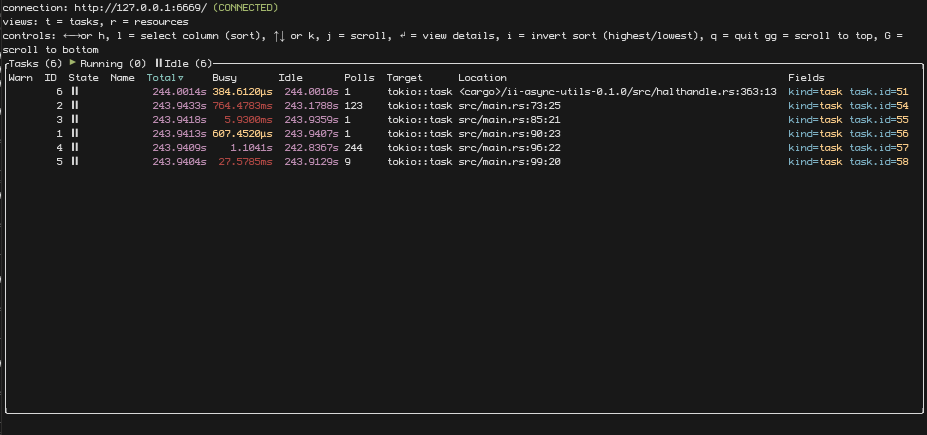
You can now navigate the console and inspect different tasks and resources, such as sleeps, intervals and mutexes.
RR debugger
Sometimes GDB may not be enough to diagnose certain problems. These are problems that may or may not happen due to random occurence, non-determinism, input from user, the file system or the network.
These leads to a class of bugs we may call heisenbugs, an homage to the Heisenberg
uncertainty principle, as that is what comes to mind trying to debug them.
This has lead to the creation of debuggers that remove non-determinism out of the
equation. RR, which stands for record and replay, stands at the forefront of
these debuggers, calling itself a "time-traveling debugger".
RR is a superset of GDB, and adds commands that let you move back in time through a particular program trace.
Setup
However, to be able to even use RR, several conditions must be met.
First, you need to install RR from your preferred source. Check out its website for more information on installing RR:
Now, keep in mind that RR is only officially supported on x86/64 Linux.
Your CPU also matters:
- AMD requires a special workaround script called
zen_workaround.py, which can be found here https://gitlab.ii.zone/lukas.hozda/workshop-debugging/-/blob/master/zen_workaround.py. Only ZEN CPUs are supported out of the whole AMD repertoire. - Intel mainstream CPUs are fine, but Intel Atom and Celeron are not supported
- ARM and its architectures only have an experimental support, nothing to write home about at this time.
Lastly, you need to decrease security regarding profiling in your kernel, so that RR can access performance data, which are necessary for producing a correct trace:
echo 1 >/proc/sys/kernelecho 1 >/proc/sys/kernel/perf_event_paranoid
All levels below 2 (1,0,-1), will work. Level 1 sacrifices the least security, and so it is used here.
Now, rr is theoretically working, and you can use it to debug C, C++ and Rust programs (And perhaps all other compatible languages like Zig or Nim or D). However, to have a great experience with Rust, you may want to consider loading its pretty-printers.
These are available in the rust-gdb and rust-lldb wrappers, but rr won't be using
a wrapper for GDB. Instead, you need to load them using the .gdbinit script, to insure
they will be available in every gdb invocation.
python
import sys

sys.path.insert(0, '/root/.rustup/toolchains/stable-x86_64-unknown-linux-gnu/lib/rustlib/etc/')

import gdb
import gdb_providers
import gdb_lookup
gdb_lookup.register_printers(gdb)
end
You are now ready to try it out :)
Compile your Rust program with debug info (either in debug profile without using
the --release flag, or by adding debug = 2 to the release profile, if you need to
inspect release profile).
We can use the randomness example from the repo attached above:
rr record target/debug/randomness
This will create a trace which will be saved under $HOME/.local/share.
You can now immediately rerun the last trace:
rr replay
RR will launch GDB stopped at the very first moment of execution. This
is not even in your binary, but in the bootstrapping code, so if you want to
seek to the beginning, you may want to set up a breakpoint at the beginning of
you main() function (use main.rs:<line> to create the breakpoint, as main()
is not the Rust main you wrote, but a Rust provided wrapper that parses the
environment into Args and such.)
You can now use all the good commands:
gdb
- s: -> step
- n: -> next
- c: -> continue
- f: -> finish

rr specific commands
- rs: -> reverse-step
- rn: -> reverse-next
- rc: -> reverse-continue
- rf: -> reverse-finish

breakpoints:
- b: -> break
- watch <symbol>
- i b: -> info break
- del: -> delete breakpoints

inspect:
- p <symbol>: -> print
- bt: -> backtrace
For example, you may try running c to see the rest of the program execution.
It should spit out the same random numbers as when you ran it while recording the trace.
The great things about traces is that they can be often transported between machines, you can send it to your coworkers to help diagnose a particular problem that only occurs in your environment.
Keep in mind that all debuggers incur a performance penalty. With rr, it is relatively
tame, only 1.5x to 2x slowdown, allegedly, but the impact will be felt more with multithreaded
loads.